Education Data Literacy

Sravani Gangula, COVID-19 Data Dashboard Project
In Summer 2024, the CIC Student Working group launched a new data science project which teaches best methods for data visualization. The project encourages students to analyze WHO regions and teaches basic Python skills. Student Working Group participants can use this project to develop independent research analysis and create a […]
Kaushik Patil, Aarushi Tuli: Spring 2024 Analyzing Pandemic Responses (APR) Project
In February 2024, the CIC Student Working Group launched a data science project on global responses to the COVID-19 pandemic. The 575+ members of the Student Working Group developed independent research analyses, practicing data science, machine learning, time series analysis, and geospatial mapping along the way. We learned to develop […]
Ethan Sonnenreich: Spring 2024 Analyzing Pandemic Responses (APR) Project
In February 2024, the CIC Student Working Group launched a data science project on global responses to the COVID-19 pandemic. The 575+ members of the Student Working Group developed independent research analyses, practicing data science, machine learning, time series analysis, and geospatial mapping along the way. We learned to develop […]
Keaton Hereid, Kenny Mark: Spring 2024 Analyzing Pandemic Responses (APR) Project
In February 2024, the CIC Student Working Group launched a data science project on global responses to the COVID-19 pandemic. The 575+ members of the Student Working Group developed independent research analyses, practicing data science, machine learning, time series analysis, and geospatial mapping along the way. We learned to develop […]
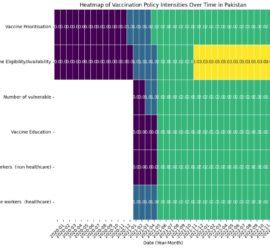
Saad Khan: Spring 2024 Analyzing Pandemic Responses (APR) Project
In February 2024, the CIC Student Working Group launched a data science project on global responses to the COVID-19 pandemic. The 575+ members of the Student Working Group developed independent research analyses, practicing data science, machine learning, time series analysis, and geospatial mapping along the way. We learned to develop […]
Sindhuja Achutuni, Cheemakurthy Navaneeth Kumar, Eslin Kiran Ilangovan, Ramya Madugula: Spring 2024 Analyzing Pandemic Responses (APR) Project
In February 2024, the CIC Student Working group launched a data science project on global responses to the COVID-19 pandemic. The 575+ members of the Student Working Group developed independent research analyses, practicing data science, machine learning, time series analysis, and geospatial mapping along the way. We learned to develop […]
NSDC Data Science Flashcards – Descriptive Statistics #6 – What is Correlation and Causation?
This NSDC Data Science Flashcards series will teach you about geospatial analysis, including visualizations, data processing, and applications. This installment of the NSDC Data Science Flashcards series was created and recorded by Emily Rothenberg. You can find these videos on the NEBDHub Youtube channel. In statistics and data analysis, understanding the concepts […]
NSDC Data Science Flashcards – Descriptive Statistics #5 – What is the Coefficient of Variation?
This NSDC Data Science Flashcards series will teach you about geospatial analysis, including visualizations, data processing, and applications. This installment of the NSDC Data Science Flashcards series was created and recorded by Emily Rothenberg. You can find these videos on the NEBDHub Youtube channel. The Coefficient of Variation is a relative measure […]
NSDC Data Science Flashcards – Descriptive Statistics #4 – What is a Standard Deviation?
This NSDC Data Science Flashcards series will teach you about geospatial analysis, including visualizations, data processing, and applications. This installment of the NSDC Data Science Flashcards series was created and recorded by Emily Rothenberg. You can find these videos on the NEBDHub Youtube channel. In statistics, Standard Deviation and Coefficient of Variation […]
NSDC Data Science Flashcards – Descriptive Statistics #3 – Solving for Sample Variance
This NSDC Data Science Flashcards series will teach you about geospatial analysis, including visualizations, data processing, and applications. This installment of the NSDC Data Science Flashcards series was created and recorded by Emily Rothenberg. You can find these videos on the NEBDHub Youtube channel. Today, we’ll be learning how to solve for […]
NSDC Data Science Flashcards – Descriptive Statistics #2 – What is variance?
This NSDC Data Science Flashcards series will teach you about geospatial analysis, including visualizations, data processing, and applications. This installment of the NSDC Data Science Flashcards series was created and recorded by Emily Rothenberg. You can find these videos on the NEBDHub Youtube channel. Welcome to our set of Data Science Flashcards […]
NSDC Data Science Flashcards – Descriptive Statistics #1 – What are the Measures of Central Tendency?
This NSDC Data Science Flashcards series will teach you about geospatial analysis, including visualizations, data processing, and applications. This installment of the NSDC Data Science Flashcards series was created and recorded by Emily Rothenberg. You can find these videos on the NEBDHub Youtube channel. Welcome to the National Student Data Corps Flashcard […]
NSDC Data Science Flashcards – Geospatial Analysis #6 – What are Geospatial Applications and Trends?
This NSDC Data Science Flashcards series will teach you about geospatial analysis, including visualizations, data processing, and applications. This installment of the NSDC Data Science Flashcards series was created and recorded by Aditya Raj. You can find these videos on the NEBDHub Youtube channel. Welcome to the video of Geospatial Applications and […]
NSDC Data Science Flashcards – Geospatial Analysis #5 – What is Advanced Geospatial Analysis?
This NSDC Data Science Flashcards series will teach you about geospatial analysis, including visualizations, data processing, and applications. This installment of the NSDC Data Science Flashcards series was created and recorded by Aditya Raj. You can find these videos on the NEBDHub Youtube channel. Today, we’re stepping into the advanced realm of […]
NSDC Data Science Flashcards – Geospatial Analysis #4 – What is Geospatial Data Processing?
This NSDC Data Science Flashcards series will teach you about geospatial analysis, including visualizations, data processing, and applications. This installment of the NSDC Data Science Flashcards series was created and recorded by Aditya Raj. You can find these videos on the NEBDHub Youtube channel. In this video, we talk about Geospatial Data […]
NSDC Data Science Flashcards – Geospatial Analysis #3 – What are Geospatial Visualizations?
This NSDC Data Science Flashcards series will teach you about geospatial analysis, including visualizations, data processing, and applications. This installment of the NSDC Data Science Flashcards series was created and recorded by Aditya Raj. You can find these videos on the NEBDHub Youtube channel. In this video, we talk about Geospatial Data […]
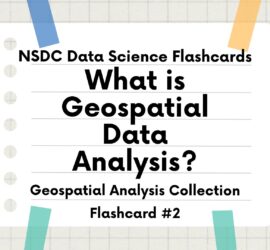
NSDC Data Science Flashcards – Geospatial Analysis #2 – What is Geospatial Data Analysis?
This NSDC Data Science Flashcards series will teach you about geospatial analysis, including visualizations, data processing, and applications. This installment of the NSDC Data Science Flashcards series was created and recorded by Aditya Raj. You can find these videos on the NEBDHub Youtube channel. In this video we talk about Geospatial Data […]
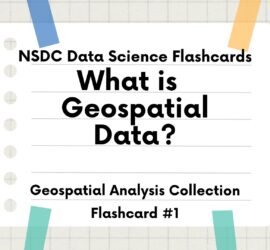
NSDC Data Science Flashcards – Geospatial Analysis #1 – What is Geospatial Data?
This NSDC Data Science Flashcards series will teach you about geospatial analysis, including visualizations, data processing, and applications. This installment of the NSDC Data Science Flashcards series was created and recorded by Aditya Raj. You can find these videos on the NEBDHub Youtube channel. In this video, we’ll embark on a journey […]
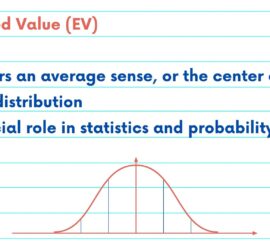
NSDC Data Science Flashcards – Probability #4 – Expected Value
This NSDC Data Science Flashcards series will teach you about probability, including random variables, probability density functions, cumulative distribution functions, and expected values. This installment of the NSDC Data Science Flashcards series was created and recorded by Stephanie Guo. You can find these videos on the NEBDHub Youtube channel. Hello […]
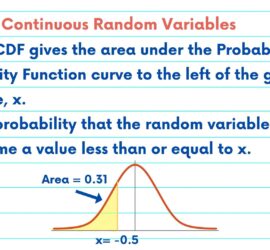
NSDC Data Science Flashcards – Probability #3 – Cumulative Distribution Function
This NSDC Data Science Flashcards series will teach you about probability, including random variables, probability density functions, cumulative distribution functions, and expected values. This installment of the NSDC Data Science Flashcards series was created and recorded by Stephanie Guo. You can find these videos on the NEBDHub Youtube channel. Hello […]
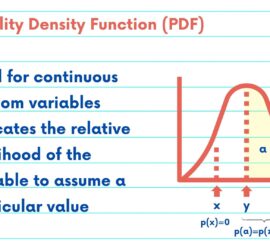
NSDC Data Science Flashcards – Probability #2 – Probability Density Functions
This NSDC Data Science Flashcards series will teach you about probability, including random variables, probability density functions, cumulative distribution functions, and expected values. This installment of the NSDC Data Science Flashcards series was created and recorded by Stephanie Guo. You can find these videos on the NEBDHub Youtube channel. Hello […]
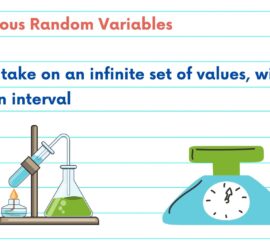
NSDC Data Science Flashcards – Probability #1 – Random Variables
This NSDC Data Science Flashcards series will teach you about probability, including random variables, probability density functions, cumulative distribution functions, and expected values. This installment of the NSDC Data Science Flashcards series was created and recorded by Stephanie Guo. You can find these videos on the NEBDHub Youtube channel. Hello […]
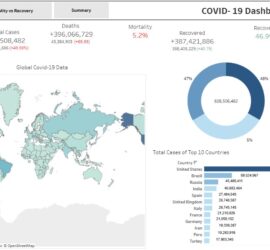
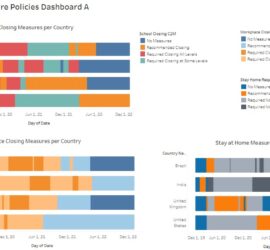
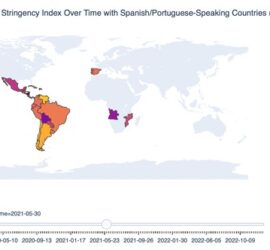
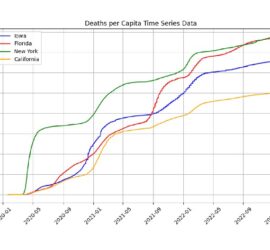
Sanket Bhandari & Varalika Mahajan: Fall 2023 COVID Information Commons Student Working Group Data Visualization Project
In October 2023, the CIC Student Working group launched our first semester-long data science education project on COVID-19 Visualization. The 300+ members of the Working Group developed independent data visualizations using tools and skills learned as a community. We learned to develop a COVID-19 research question and explored time series analysis […]
Christopher Sanchez: Fall 2023 COVID Information Commons Student Working Group Data Visualization Project
In October 2023, the CIC Student Working group launched our first semester-long data science education project on COVID-19 Visualization. The 300+ members of the Working Group developed independent data visualizations using tools and skills learned as a community. We learned to develop a COVID-19 research question and explored time series analysis […]
Sahand Ahmadi: Fall 2023 COVID Information Commons Student Working Group Data Visualization Project
In October 2023, the CIC Student Working group launched our first semester-long data science education project on COVID-19 Visualization. The 300+ members of the Working Group developed independent data visualizations using tools and skills learned as a community. We learned to develop a COVID-19 research question and explored time series analysis […]
Jared De La Serna: Fall 2023 COVID Information Commons Student Working Group Data Visualization Project
In October 2023, the CIC Student Working group launched our first semester-long data science education project on COVID-19 Visualization. The 300+ members of the Working Group developed independent data visualizations using tools and skills learned as a community. We learned to develop a COVID-19 research question and explored time series analysis […]
Hangqi Wu: Fall 2023 COVID Information Commons Student Working Group Data Visualization Project
In October 2023, the CIC Student Working group launched our first semester-long data science education project on COVID-19 Visualization. The 300+ members of the Working Group developed independent data visualizations using tools and skills learned as a community. We learned to develop a COVID-19 research question and explored time series analysis […]
Li-Yung Wang: Fall 2023 COVID Information Commons Student Working Group Data Visualization Project
In October 2023, the CIC Student Working group launched our first semester-long data science education project on COVID-19 Visualization. The 300+ members of the Working Group developed independent data visualizations using tools and skills learned as a community. We learned to develop a COVID-19 research question and explored time series analysis […]
Sisan Tuedor: Fall 2023 COVID Information Commons Student Working Group Data Visualization Project
In October 2023, the CIC Student Working group launched our first semester-long data science education project on COVID-19 Visualization. The 300+ members of the Working Group developed independent data visualizations using tools and skills learned as a community. We learned to develop a COVID-19 research question and explored time series analysis […]
Scott Ren: Fall 2023 COVID Information Commons Student Working Group Data Visualization Project
In October 2023, the CIC Student Working group launched our first semester-long data science education project on COVID-19 Visualization. The 300+ members of the Working Group developed independent data visualizations using tools and skills learned as a community. We learned to develop a COVID-19 research question and explored time series analysis […]
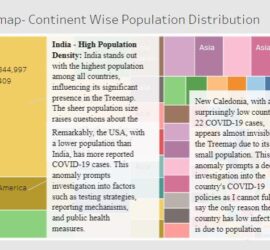
Minh Le, Diep Le, Huy Nguyen: Fall 2023 COVID Information Commons Student Working Group Data Visualization Project
In October 2023, the CIC Student Working group launched our first semester-long data science education project on COVID-19 Visualization. The 300+ members of the Working Group developed independent data visualizations using tools and skills learned as a community. We learned to develop a COVID-19 research question and explored time series analysis […]
NSDC Data Science Flashcards – Data Visualizations #7 – What is a Heat Map?
This NSDC Data Science Flashcards series will teach you about data visualizations, including scatterplots, histograms, and heat maps. This installment of the NSDC Data Science Flashcards series was created by Varalika Mahajan and Sneha Dahiya. Recordings were done by Aditya Raj, Sneha Dahiya, Lauren Close, and Emily Rothenberg. You can […]
NSDC Data Science Flashcards – Data Visualizations #6 – What is a Scatterplot?
This NSDC Data Science Flashcards series will teach you about data visualizations, including scatterplots, histograms, and heat maps. This installment of the NSDC Data Science Flashcards series was created by Varalika Mahajan and Sneha Dahiya. Recordings were done by Aditya Raj, Sneha Dahiya, Lauren Close, and Emily Rothenberg. You can […]
NSDC Data Science Flashcards – Data Visualizations #5 – What is a Line Graph?
This NSDC Data Science Flashcards series will teach you about data visualizations, including scatterplots, histograms, and heat maps. This installment of the NSDC Data Science Flashcards series was created by Varalika Mahajan and Sneha Dahiya. Recordings were done by Aditya Raj, Sneha Dahiya, Lauren Close, and Emily Rothenberg. You can […]
NSDC Data Science Flashcards – Data Visualizations #4 – What is a Pie Chart?
This NSDC Data Science Flashcards series will teach you about data visualizations, including scatterplots, histograms, and heat maps. This installment of the NSDC Data Science Flashcards series was created by Varalika Mahajan and Sneha Dahiya. Recordings were done by Aditya Raj, Sneha Dahiya, Lauren Close, and Emily Rothenberg. You can […]
NSDC Data Science Flashcards – Data Visualizations #3 – What is a Histogram?
This NSDC Data Science Flashcards series will teach you about data visualizations, including scatterplots, histograms, and heat maps. This installment of the NSDC Data Science Flashcards series was created by Varalika Mahajan and Sneha Dahiya. Recordings were done by Aditya Raj, Sneha Dahiya, Lauren Close, and Emily Rothenberg. You can […]
NSDC Data Science Flashcards – Data Visualizations #2 – What is a Bar Chart?
This NSDC Data Science Flashcards series will teach you about data visualizations, including scatterplots, histograms, and heat maps. This installment of the NSDC Data Science Flashcards series was created by Varalika Mahajan and Sneha Dahiya. Recordings were done by Aditya Raj, Sneha Dahiya, Lauren Close, and Emily Rothenberg. You can […]
NSDC Data Science Flashcards – Data Visualizations #1 – What are the Types of Data Visualization?
This NSDC Data Science Flashcards series will teach you about data visualizations, including scatterplots, histograms, and heat maps. This installment of the NSDC Data Science Flashcards series was created by Varalika Mahajan and Sneha Dahiya. Recordings were done by Aditya Raj, Sneha Dahiya, Lauren Close, and Emily Rothenberg. You can […]
Teaching Responsible Data Science through Cybersecurity Analytics
Guest post by Dr. S. Jay Yang, Rochester Institute of Technology (RIT) This Success Story is a report on the results of one of the awards in the Northeast Big Data Innovation Hub’s 2021 Seed Fund program. There were three primary objectives for this project: 1) To compile cybersecurity datasets […]
NSDC Data Science Flashcards – Time Series #6 – How Do You Evaluate Time Series Models?
This NSDC Data Science Flashcards series will teach you about time series analysis, including data preprocessing, decomposition, plots, and forecasting. This installment of the NSDC Data Science Flashcards series was created by Varalika Mahajan. Recordings were done by Aditya Raj. You can find these videos on the NEBDHub Youtube channel. […]
NSDC Data Science Flashcards – Time Series #5 – What are Time Series Forecasting Methods?
This NSDC Data Science Flashcards series will teach you about time series analysis, including data preprocessing, decomposition, plots, and forecasting. This installment of the NSDC Data Science Flashcards series was created by Varalika Mahajan. Recordings were done by Aditya Raj. You can find these videos on the NEBDHub Youtube channel. […]
NSDC Data Science Flashcards – Time Series #4 – What are Time Series Plots?
This NSDC Data Science Flashcards series will teach you about time series analysis, including data preprocessing, decomposition, plots, and forecasting. This installment of the NSDC Data Science Flashcards series was created by Varalika Mahajan. Recordings were done by Aditya Raj. You can find these videos on the NEBDHub Youtube channel. […]
NSDC Data Science Flashcards – Time Series #3 – What is Time Series Decomposition?
This NSDC Data Science Flashcards series will teach you about time series analysis, including data preprocessing, decomposition, plots, and forecasting. This installment of the NSDC Data Science Flashcards series was created by Varalika Mahajan. Recordings were done by Aditya Raj. You can find these videos on the NEBDHub Youtube channel. […]
NSDC Data Science Flashcards – Time Series #2 – What is Time Series Data Preprocessing?
This NSDC Data Science Flashcards series will teach you about time series analysis, including data preprocessing, decomposition, plots, and forecasting. This installment of the NSDC Data Science Flashcards series was created by Varalika Mahajan. Recordings were done by Aditya Raj. You can find these videos on the NEBDHub Youtube channel. […]
NSDC Data Science Flashcards – Time Series #1 – What is Time Series Analysis?
This NSDC Data Science Flashcards series will teach you about time series analysis, including data preprocessing, decomposition, plots, and forecasting. This installment of the NSDC Data Science Flashcards series was created by Varalika Mahajan. Recordings were done by Aditya Raj. You can find these videos on the NEBDHub Youtube channel. […]
NSDC Data Science Flashcards – Types of Data Card #4 – What Is Interval and Ratio Data?
This NSDC Data Science Flashcards series will teach you about the different kinds of data, including how you can use them to strengthen your research. This installment of the NSDC Data Science Flashcards series was created by Varalika Mahajan. Recordings were done by Sneha Dahiya. You can find these videos […]
NSDC Data Science Flashcards – Types of Data Card #3 – What is Nominal and Ordinal Data?
This NSDC Data Science Flashcards series will teach you about the different kinds of data, including how you can use them to strengthen your research. This installment of the NSDC Data Science Flashcards series was created by Varalika Mahajan. Recordings were done by Sneha Dahiya. You can find these videos […]
NSDC Data Science Flashcards – Types of Data Card #2 – What is Qualitative and Quantitative Data?
This NSDC Data Science Flashcards series will teach you about the different kinds of data, including how you can use them to strengthen your research. This installment of the NSDC Data Science Flashcards series was created by Varalika Mahajan. Recordings were done by Sneha Dahiya. You can find these videos […]
NSDC Data Science Flashcards – Types of Data Card #1 – What Are the Types of Data?
This NSDC Data Science Flashcards series will teach you about the different kinds of data, including how you can use them to strengthen your research. This installment of the NSDC Data Science Flashcards series was created by Varalika Mahajan. Recordings were done by Sneha Dahiya. You can find these videos […]
NSDC Data Science Flashcards – Data Science Ethics Card #6 – 5 V’s of Big Data
This NSDC Data Science Flashcards series will teach you about the importance of data ethics. This installment of the NSDC Data Science Flashcards series was created by Florence Hudson and Varalika Mahajan. Recordings were done by Lauren Close, Florence Hudson, and Emily Rothenberg. You can find these videos on the […]
NSDC Data Science Flashcards – Data Science Ethics Card #5 – Algorithmic Fairness
This NSDC Data Science Flashcards series will teach you about the importance of data ethics. This installment of the NSDC Data Science Flashcards series was created by Florence Hudson and Varalika Mahajan. Recordings were done by Lauren Close, Florence Hudson, and Emily Rothenberg. You can find these videos on the […]
NSDC Data Science Flashcards – Data Science Ethics Card #4 – FAIR Principles Part 2
This NSDC Data Science Flashcards series will teach you about the importance of data ethics. This installment of the NSDC Data Science Flashcards series was created by Florence Hudson and Varalika Mahajan. Recordings were done by Lauren Close, Florence Hudson, and Emily Rothenberg. You can find these videos on the […]