This NSDC Data Science Flashcards series will teach you about time series analysis, including data preprocessing, decomposition, plots, and forecasting. This installment of the NSDC Data Science Flashcards series was created by Varalika Mahajan. Recordings were done by Aditya Raj. You can find these videos on the NEBDHub Youtube channel.
Today, we’re going to explore a critical step in the Time Series data analysis process – Data Preprocessing.
Imagine you have a time series dataset with irregular time intervals, missing values, or outliers. Before you can extract meaningful insights, you need to clean up and prepare the data. This is where Time Series Data Preprocessing comes into play.
In this series, we’ll be including Python sample codes to demonstrate real-world applications of time-series concepts. These codes will help you bridge the gap between theory and practice.
Here are some key aspects of Time Series Data Preprocessing:
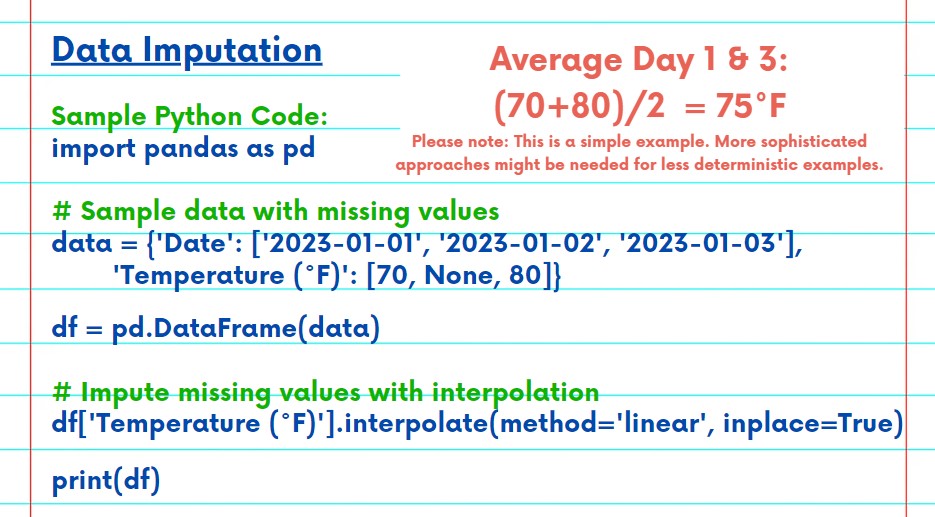
1. Data Imputation
Missing data is a common issue in time series datasets. Let’s say you’re dealing with daily temperature data, and some days have missing values. To address this, you can use data imputation techniques. One way to impute the missing temperature on Day 2 is by interpolating it between the temperatures on Day 1 (70°F) and Day 3 (80°F). The interpolated temperature for Day 2 would be (70°F + 80°F) / 2 = 75°F.
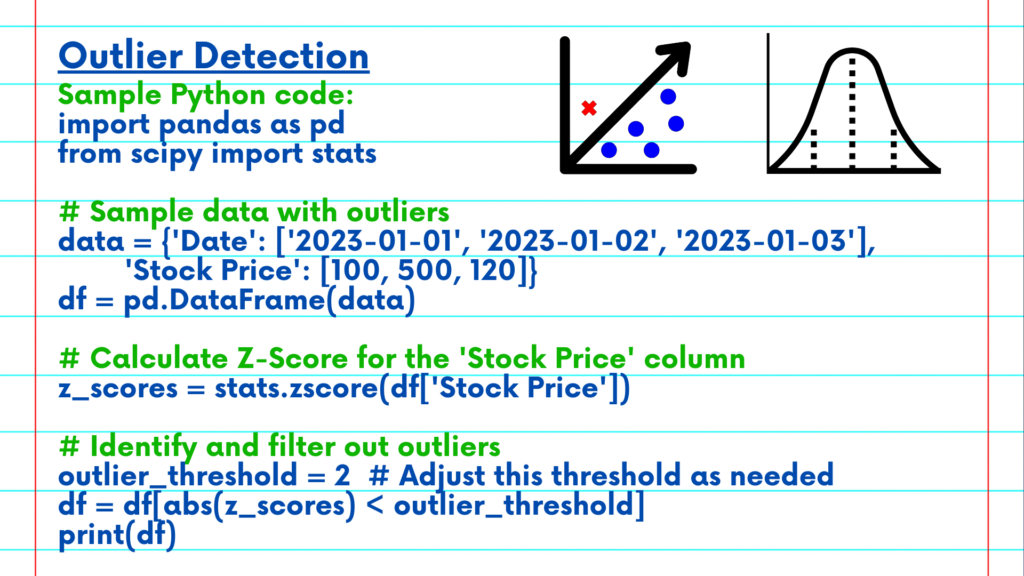
2. Outlier Detection
Outliers can distort your analysis. For instance, when analyzing a stock price time series, you might identify outliers using statistical methods like the Z-score or visualization tools like box plots. An extreme value that falls significantly outside the normal range can be considered an outlier and should be carefully assessed.

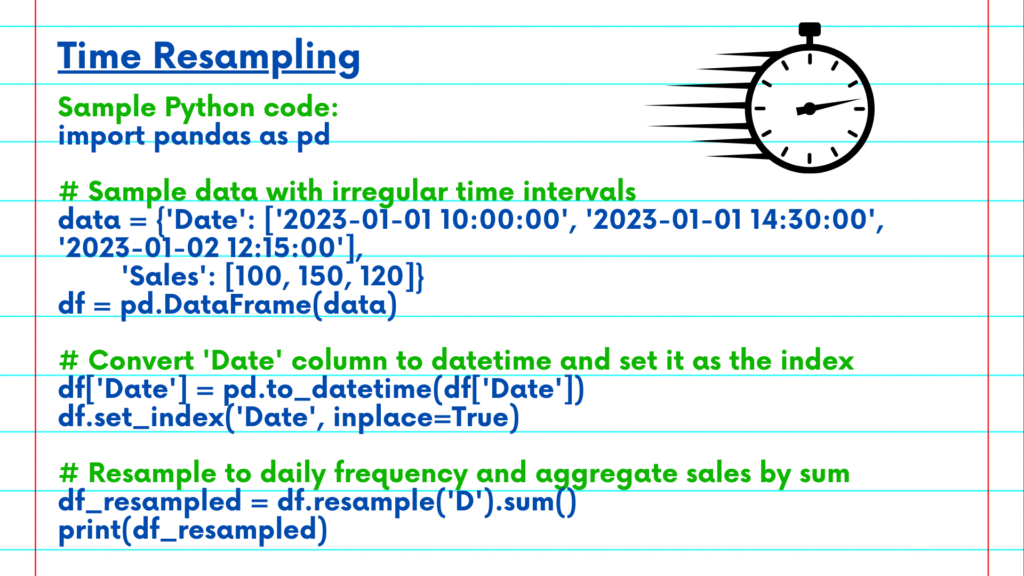
3. Time Resampling
Sometimes, your time series data may be recorded at irregular intervals. To standardize the time intervals, you can use time resampling. For example, if you have sales data recorded at various times during a day, you can resample it to a consistent frequency, such as daily. This involves aggregating the data for each day, summing up the sales figures for that day.
4. Seasonal Decomposition
Understanding the underlying patterns in your time series data is crucial. Seasonal decomposition helps with this. If you’re working with monthly sales data, you can decompose it into its seasonal, trend, and residual components. This allows you to identify patterns related to seasonality (e.g., holiday sales spikes), the overall trend (e.g., increasing sales over time), and random fluctuations.
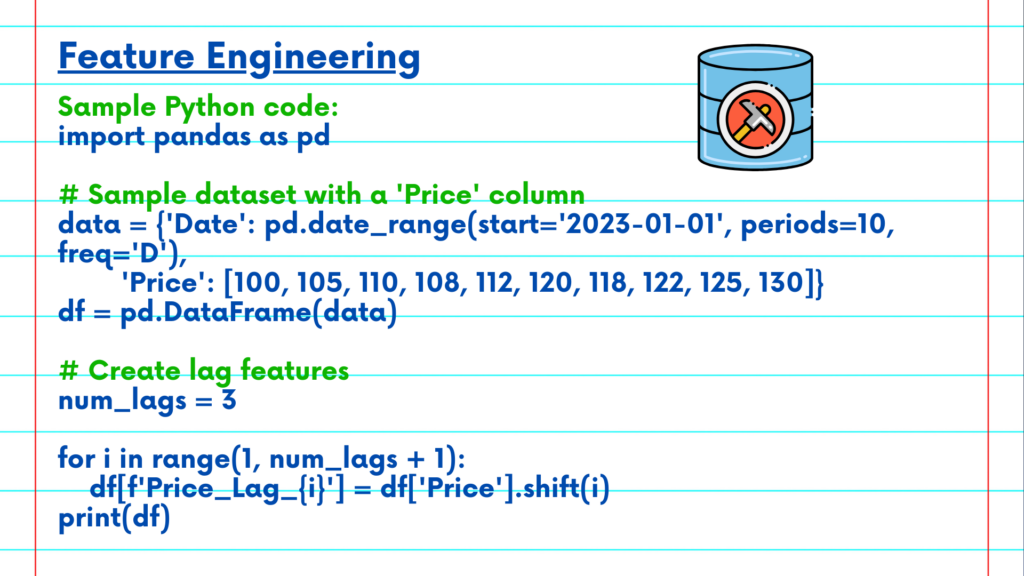
5. Feature Engineering
To enhance your analysis and prediction models, you can create additional features from your time series data through feature engineering. Let’s say you want to predict future stock prices. You can create lag features by adding columns with past stock prices. For example, you might add columns for the stock price one day ago, two days ago, and so on. These lag features help your model capture dependencies on past prices.
Time Series Data Preprocessing is the foundation for accurate and insightful time series analysis. By addressing missing data, outliers, and other data issues, you ensure that your analyses and predictions are based on reliable and meaningful information.
Please follow along with the rest of the NSDC Data Science Flashcard series to learn more about time series analysis.