This NSDC Data Science Flashcards series will teach you about geospatial analysis, including visualizations, data processing, and applications. This installment of the NSDC Data Science Flashcards series was created and recorded by Emily Rothenberg. You can find these videos on the NEBDHub Youtube channel.
In statistics, Standard Deviation and Coefficient of Variation are important measures that help us understand the variability and relative variability within a dataset. This tutorial will explain both concepts with examples and show you how to calculate them.
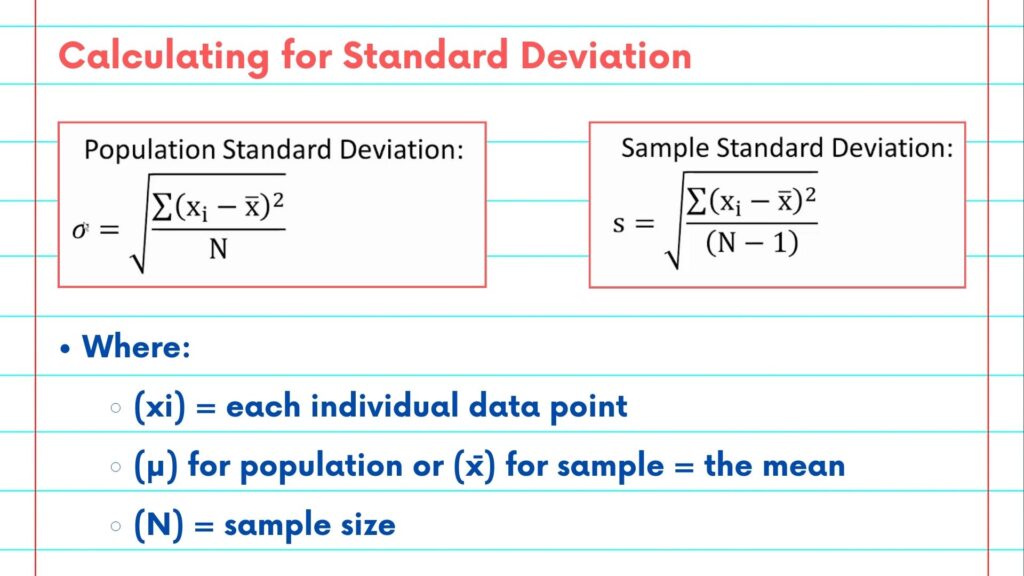
Standard Deviation measures how spread out the values in a dataset are from the mean (average). It quantifies the amount of variation or dispersion in the data.

Calculation:
For a population (when you have data for the entire population):
\[σ = \sqrt{Σ(x – μ)^2 / N}\]
For a **sample** (when you have data from a subset of the population):
\[s = \sqrt{Σ(x – x̄)^2 / (N-1)}\]
Where:
– \(x\) represents each individual data point.
– \(μ\) (for population) or \(x̄\) (for sample) is the mean of the data.
– \(N\) is the total number of data points.
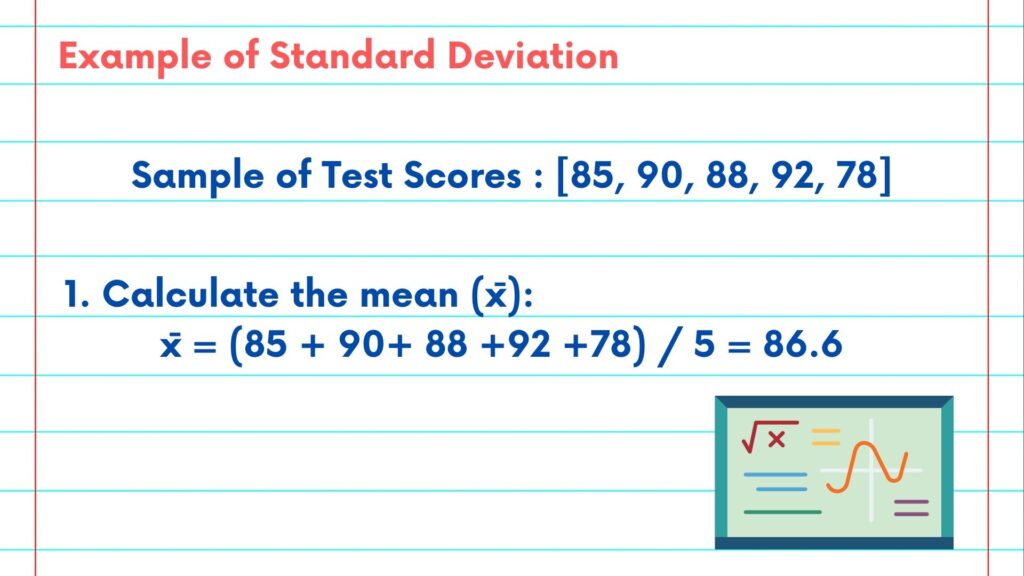
Let’s calculate the standard deviation for a sample of test scores: [85, 90, 88, 92, 78].
1. Calculate the mean (\(x̄\)):
\[x̄ = (85 + 90 + 88 + 92 + 78) / 5 = 86.6\]
To calculate the mean, we will add up all of the data points in our sample, and divide by the sample size. When we do this, we see that the mean of this sample is 86.6.
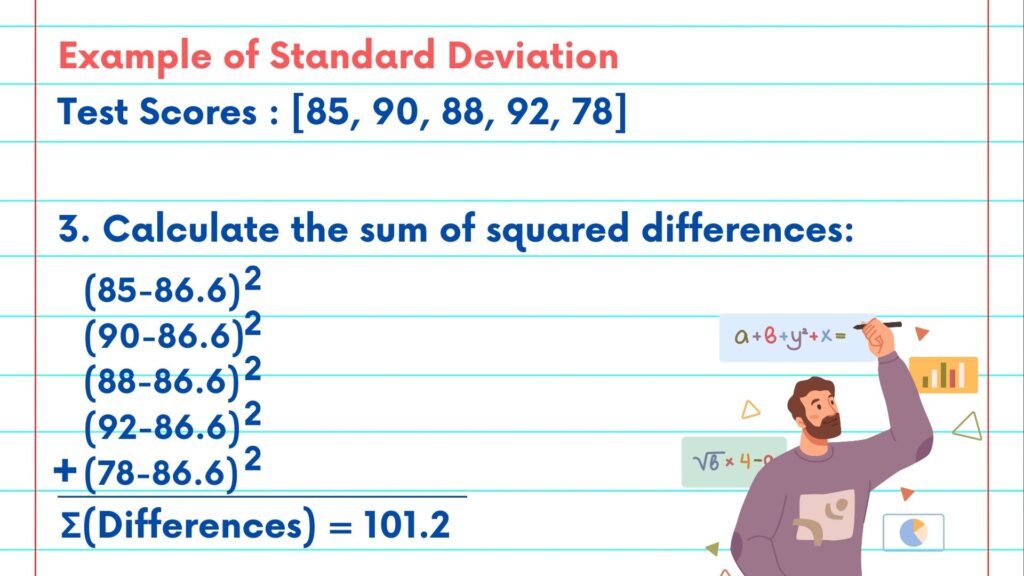
2. Calculate the squared differences from the mean for each data point:
\[Differences = [(85-86.6)^2, (90-86.6)^2, (88-86.6)^2, (92-86.6)^2, (78-86.6)^2]\]
Simply, we are trying to solve for the distance between each data point and the mean. In order to do this, we will subtract the mean from each data point in our sample.
3. Then, we will square each of the differences we just solved for.

4. Now, we need to Calculate the sum of squared differences: Let’s add up all of the numbers we just calculated.
\[Σ(Differences) = 101.2\]
5. The last step will be to Divide by \(N-1\) and to take the square root of our answer. Since this is a sample with 5 data points, n-1 will be equal to 4):
\[s = \sqrt{Σ(Differences) / (5-1)} = \sqrt{101.2 / 4} ≈ 5.03\]

Once we complete this calculation, we can see the standard deviation for this sample is approximately 5.03.
Thank you all for watching. Please follow along with the rest of the NSDC Flashcard Video Series to learn more.
Please follow along with the rest of the NSDC Data Science Flashcard series to learn more about math and probability.