This NSDC Data Science Flashcards series will teach you about data visualizations, including scatterplots, histograms, and heat maps. This installment of the NSDC Data Science Flashcards series was created by Varalika Mahajan and Sneha Dahiya. Recordings were done by Aditya Raj, Sneha Dahiya, Lauren Close, and Emily Rothenberg. You can find these videos on the NEBDHub Youtube channel.
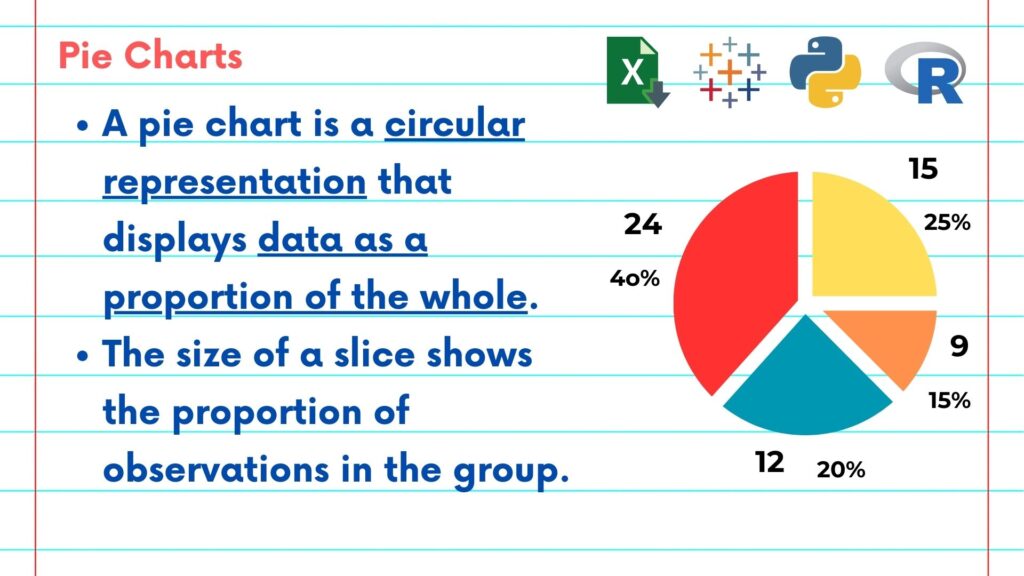
In this video, we’ll be talking about pie charts. So what is a pie chart? A pie chart is a circular representation that displays data as a proportion of the whole. Pie charts are plotted to compare and visualize different proportions of data in each category. Each slice in a pie chart corresponds to a specific category or segment in the data. The size of a slice shows the proportions of observations in each group. We can represent these segments by either using discrete numbers or percentages. We can also plot these pie charts using different softwares available such as Microsoft Excel, Tableau, Python, and R to name a few.
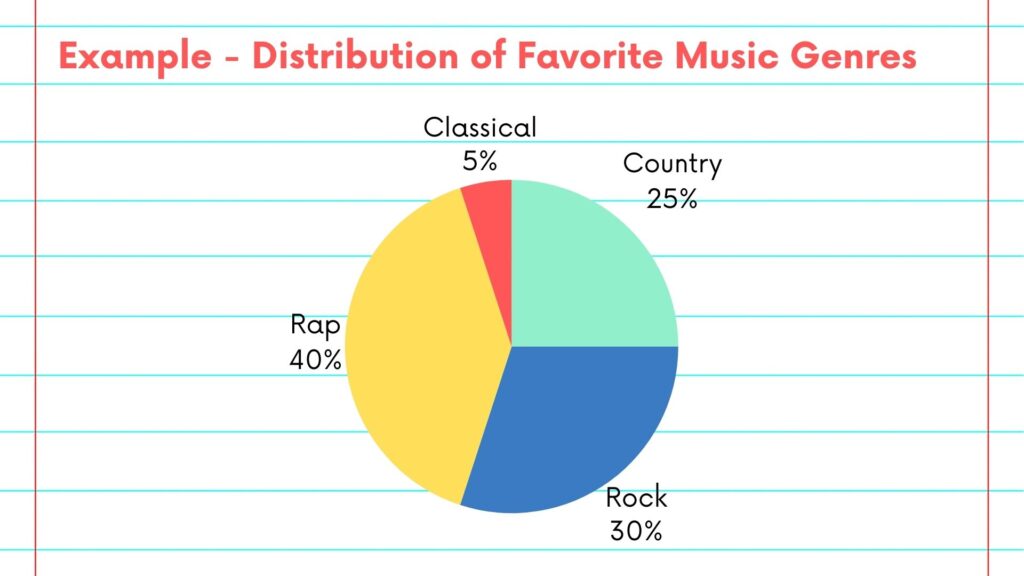
Now, let’s take a look at an example of distribution of favorite music genres in a group of particular students. As you can see from the pie chart we can observe that rap music is the most popular genre in the group and is preferred by around 40% of the students. Classical music, on the other hand, is the least popular genre with around 5% of all the students in the group.
Please follow along with the rest of the NSDC Data Science Flashcard series to learn more about data visualizations.