This NSDC Data Science Flashcards series will teach you about geospatial analysis, including visualizations, data processing, and applications. This installment of the NSDC Data Science Flashcards series was created and recorded by Emily Rothenberg. You can find these videos on the NEBDHub Youtube channel.
In statistics and data analysis, understanding the concepts of correlation and causation is essential.
Let’s begin with the definition of correlation.
Correlation is a statistical measure that quantifies the degree of which two variables are related to each other.
The most common measure of correlation is the Pearson correlation coefficient, denoted as r, which ranges from -1 to 1.
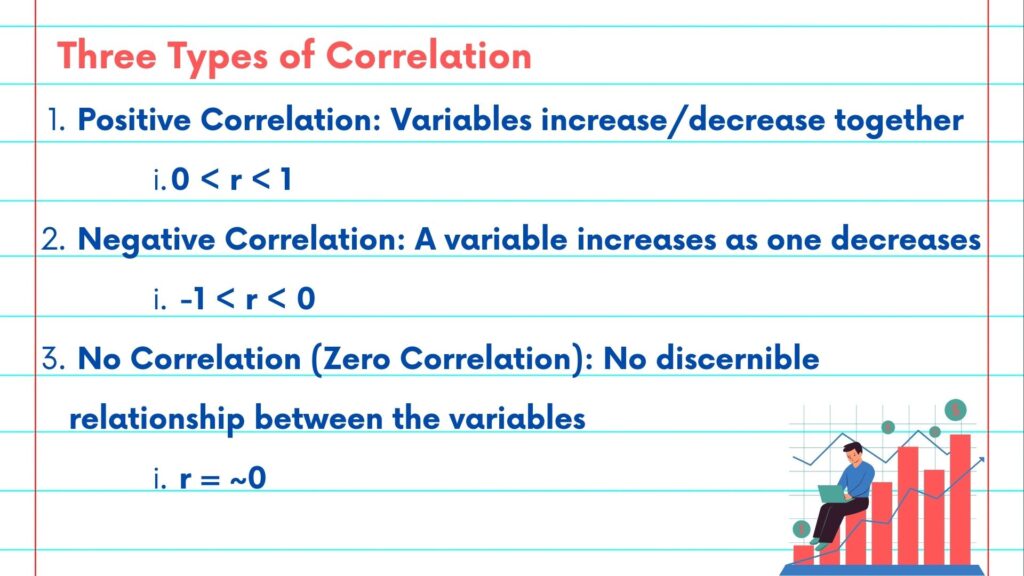
There are three Types of Correlation:
- Positive Correlation: When both variables increase or decrease together. The correlation coefficient will be positive, typically ranging from 0 to 1.
- Negative Correlation: When one variable increases as the other decreases, and vice versa. The correlation coefficient will be negative, typically ranging from -1 to 0.
- No Correlation (Zero Correlation): When there is no discernible relationship between the variables. The correlation coefficient will be approximately 0.
Let’s look at an example. Consider a dataset that contains the number of hours spent studying for an exam (\(x\)) and the exam scores (\(y\)) of a group of students. To assess the correlation between study time and exam scores, you could calculate the Pearson correlation coefficient by using the following formula.
- \[r = \frac{Σ[(x – x̄)(y – ȳ)]}{\sqrt{Σ(x – x̄)^2 * Σ(y – ȳ)^2}}\]
Where:
– \(x\) and \(y\) are the data points of the two variables.
– \(x̄\) and \(ȳ\) are the means of the two variables.
3. Once you solve for r, you can Interpret the correlation:
– If \(r\) is positive (e.g., 0.7), it indicates a positive correlation, suggesting that as study time increases, exam scores tend to increase as well.
– If \(r\) is negative (e.g., -0.5), it indicates a negative correlation, suggesting that as study time increases, exam scores tend to decrease.
– If \(r\) is close to 0 (e.g., 0.1), it indicates little to no correlation, suggesting that study time and exam scores are not strongly related.

Now let’s discuss causation:
Causation implies a cause-and-effect relationship between two variables, where one variable directly influences or causes changes in the other. However, establishing causation is more complex than identifying correlation.

To establish causation between study time and exam scores, you would need to conduct a controlled experiment where you manipulate study time (e.g., one group studies more, and another studies less) while keeping all other variables constant. Only then can you attribute changes in exam scores directly to variations in study time.
Remember: “Correlation does not imply causation.” Just because two variables are correlated does not mean that one causes the other. There may be hidden factors or coincidences at play. Think about the following: ice cream sales and shark sightings tend to increase with each other. Does this mean you will see a shark because you bought an ice cream cone? No. These variables are simply correlated. This is because there is an underlying variable, in this instance, warmer weather, that influences both ice cream sales and shark sightings.

Please follow along with the rest of the NSDC Data Science Flashcard series to learn more about math and probability.