This NSDC Data Science Flashcards series will teach you about geospatial analysis, including visualizations, data processing, and applications. This installment of the NSDC Data Science Flashcards series was created and recorded by Emily Rothenberg. You can find these videos on the NEBDHub Youtube channel.
Welcome to the National Student Data Corps Flashcard Video Series. In this video we’ll be talking about measures of central tendencies.
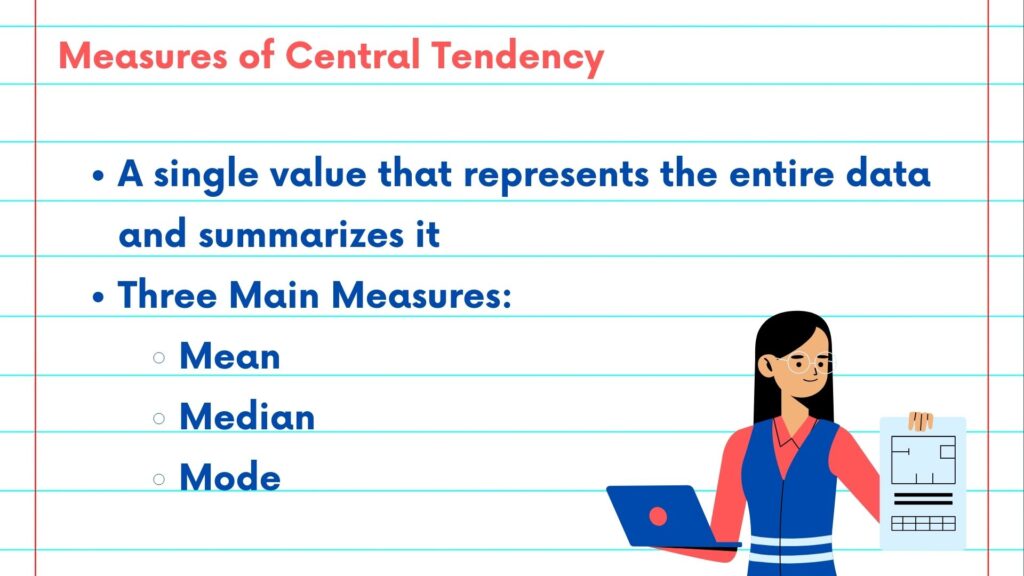
A measure of central tendency is a single value numerical number that represents the entire data and summarizes it to give us some initial insights.
There are three main measures of central tendency:
- Mean
- Median
- Mode
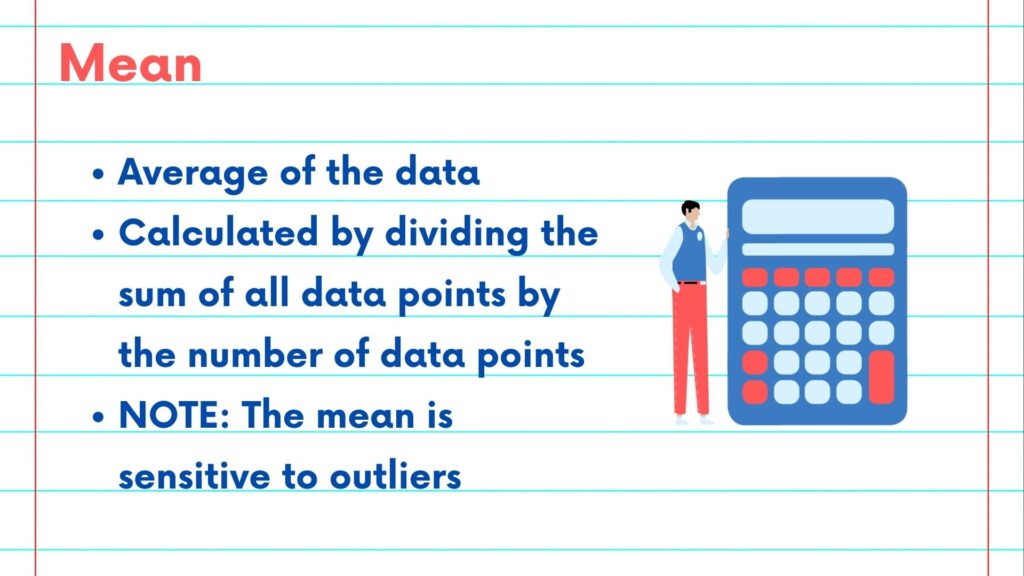
Mean: mean or the arithmetic average of the data can be calculated by dividing the sum of all data points by the number of data points:
Sum of all values⁄No. of values.
It gives us an idea about the average value of the data.
However, mean is sensitive to outliers and may not always accurately represent the data.
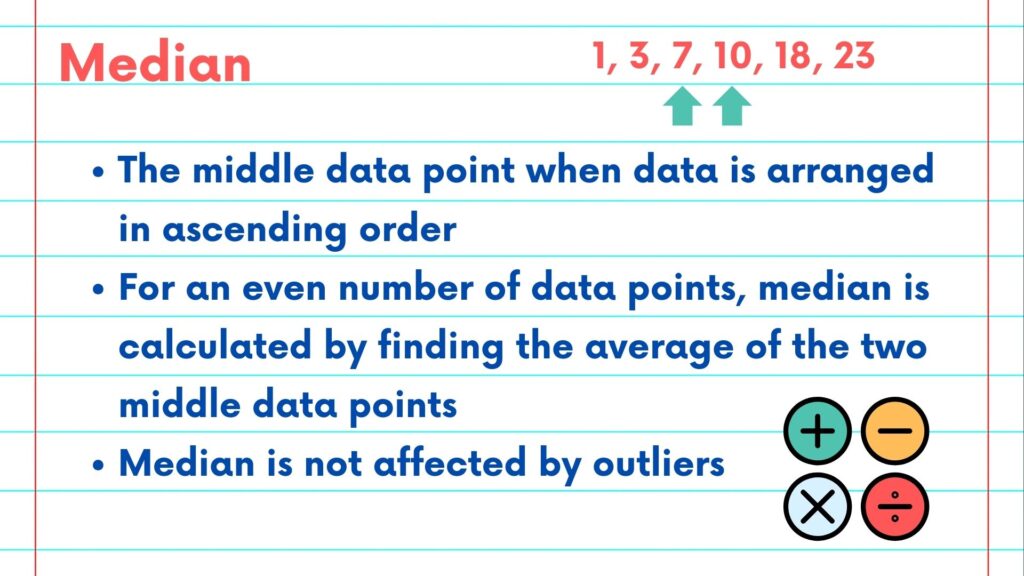
Median: Median is the second measure of central tendency which is the middle data point when all the data points are arranged in ascending order. For an even number of data points, the median can be calculated by taking the average of the two middle data points.
Unlike the mean, median is not affected by outliers and is a good representative for skewed data.
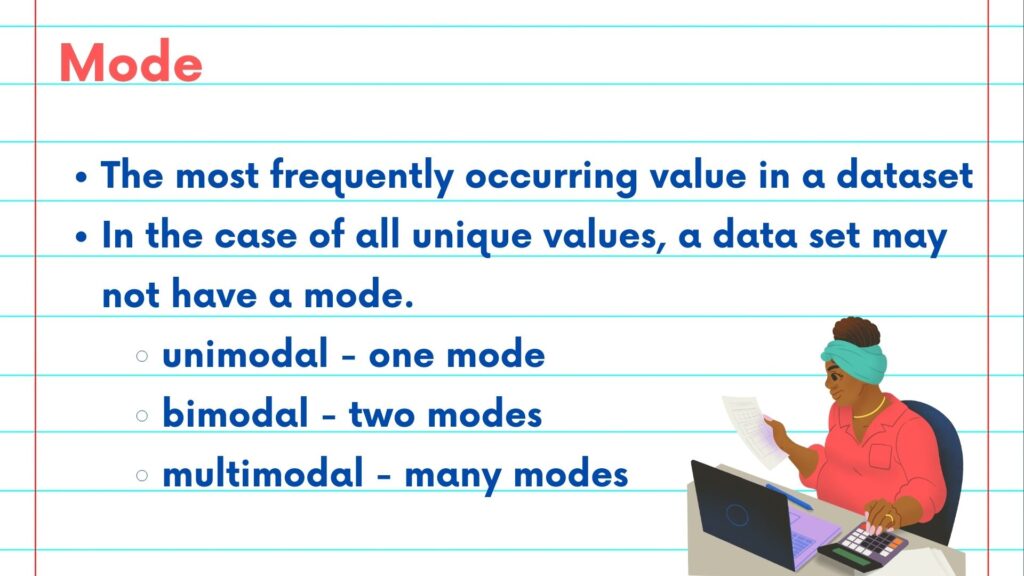
Mode: The third measure of central tendency is mode which is the most frequently occurring value in a dataset. A data set may not have a mode in the case of all unique values, it can be unimodal, bi modal or multimodal depending on the number highest occurring values in a data set.
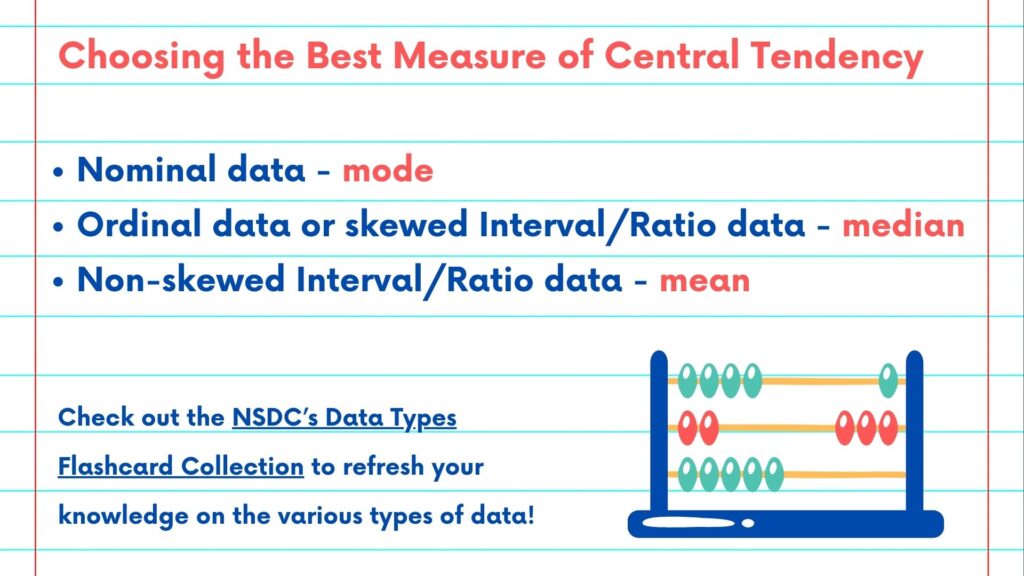
Different types of data points can be summarized by different measure of central tendency:
For Nominal data, the mode is the best measure of central tendency, For ordinal data or, skewed interval and ratio data, the median should be used, while for non-skewed interval and ratio variables, the mean is better.
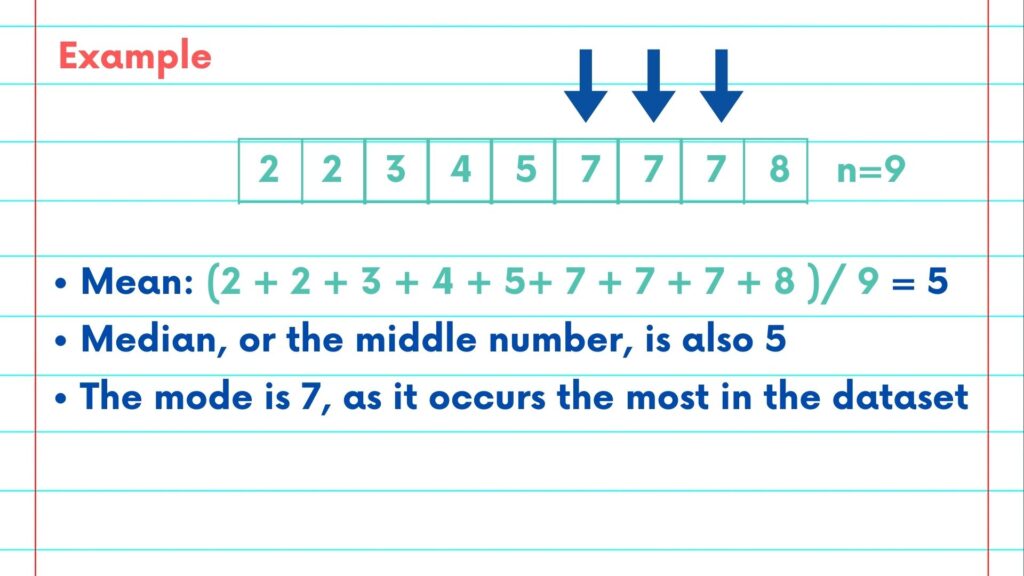
Now, let us consider the following data points arranged in ascending order.
We can calculate that mean of this data set is 5, [include formulas on the screen]
The median happens to also be 5
And mode is 7 which occurs 3 times in the entire data set.
Thank you so much for watching, please follow along with the rest of the NSDC Data Science Flashcard Series to learn more.
Please follow along with the rest of the NSDC Data Science Flashcard series to learn more about math and probability.