This NSDC Data Science Flashcards series will teach you about geospatial analysis, including visualizations, data processing, and applications. This installment of the NSDC Data Science Flashcards series was created and recorded by Aditya Raj. You can find these videos on the NEBDHub Youtube channel.
In this video, we talk about Geospatial Data Visualization, where Python and creativity come together to bring location-based data to life.
Geospatial Data Visualization is like painting a portrait of our world, using Python as our brush and the map as our canvas.
But why is it so crucial? Well, because visuals are powerful, and Python makes it easier than ever to create them.
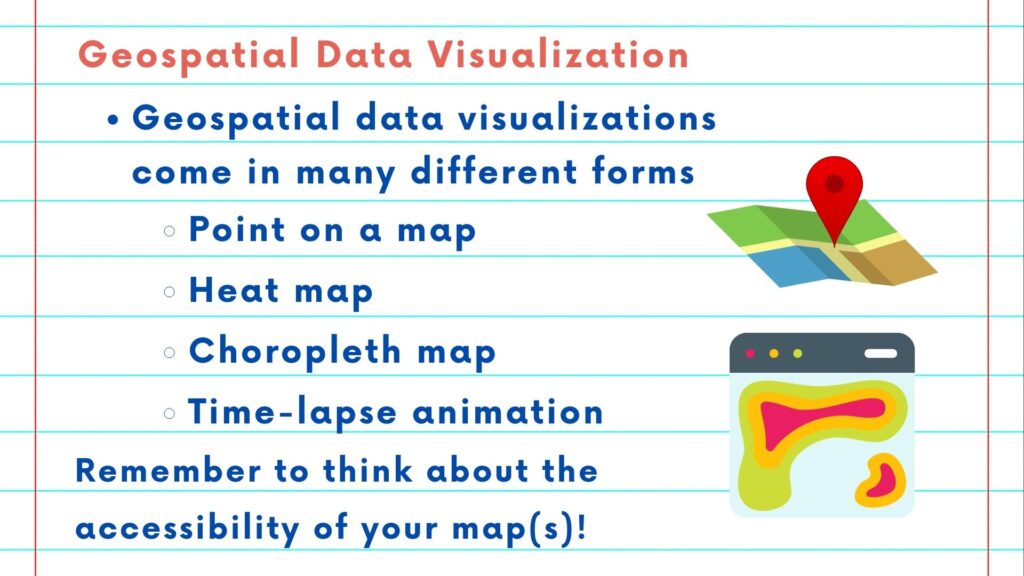
Geospatial Data Visualization with Python comes in many forms. It could be a simple dot on a map, representing a location. Or it might be a heatmap, showing us concentrations of activity.
It could also be a choropleth map, coloring regions based on data values, or a time-lapse animation, revealing changes over time – all achieved with Python.
The goal is to make data understandable, accessible, and meaningful. Python’s libraries and packages make it possible.
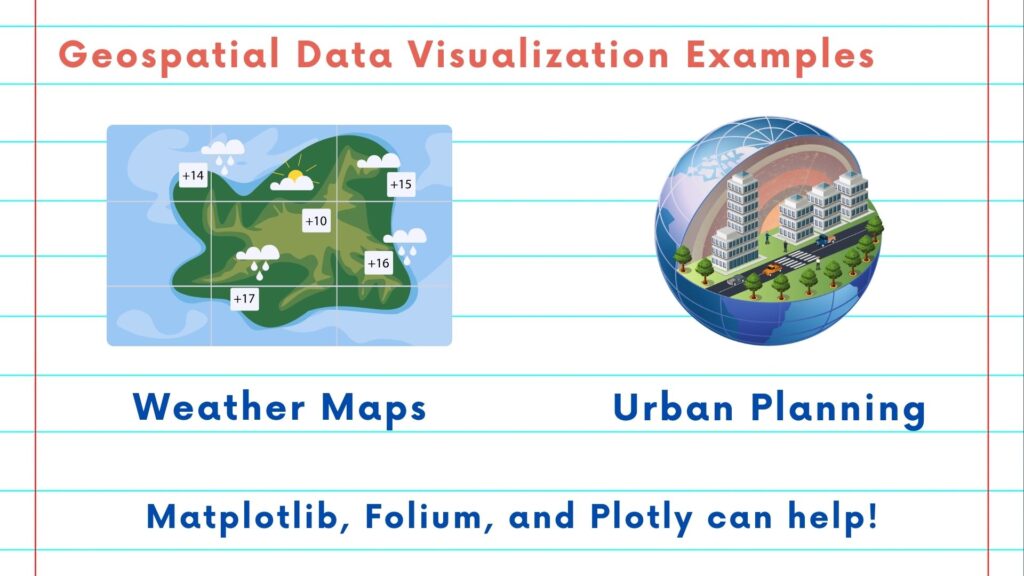
Think about weather forecasts. When you see a weather map, it’s not just a bunch of numbers. It’s a visual story that helps you plan your day, created with Python.
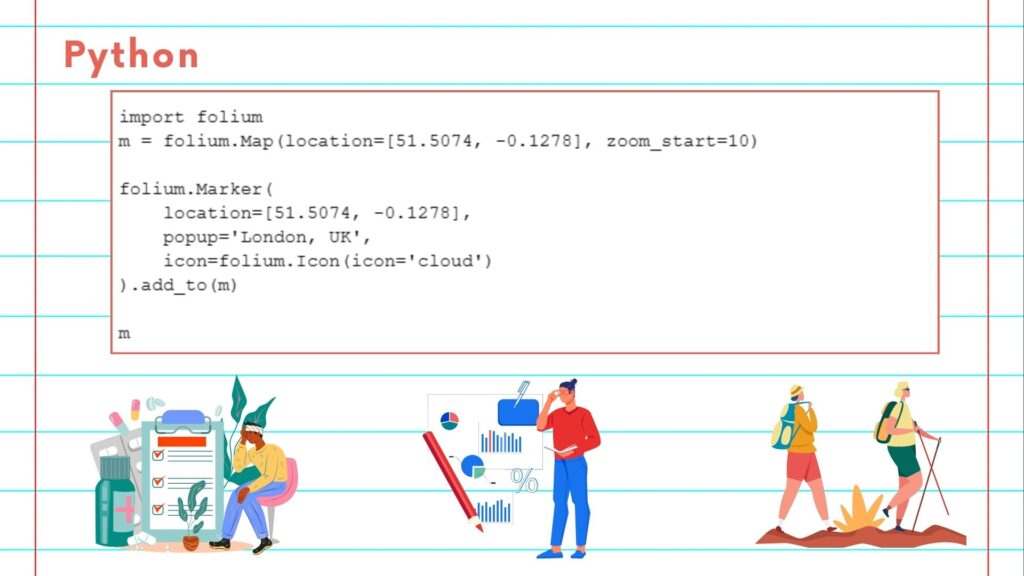
Or consider the impact on urban planning. Visualization can reveal traffic patterns, land use, and areas in need of improvement, all thanks to Python. Now, you might wonder, how is this done? Python offers a wealth of tools and libraries for geospatial data visualization, such as Matplotlib, Folium, and Plotly.
These libraries allow you to create, customize, and interact with maps, adding layers of data to tell your story using Python. And the best part? You don’t need to be a Python expert to get started. Python’s user-friendly syntax makes it accessible to everyone.
Whether you’re tracking the spread of diseases, analyzing customer locations for a business, or planning a hiking trip, Python empowers you to see the world in a whole new way.
In the upcoming videos, we’ll delve deeper into geospatial data.
Please follow along with the rest of the NSDC Data Science Flashcard series to learn more about math and probability.