NSDC Data Science Flashcards – Probability #2 – Probability Density Functions
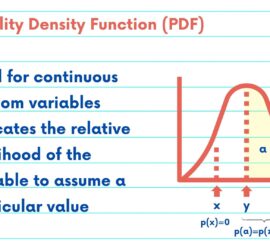
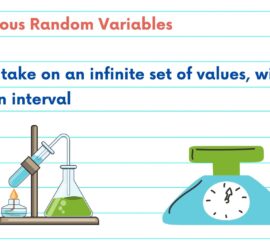
This NSDC Data Science Flashcards series will teach you about probability, including random variables, probability density functions, cumulative distribution functions, and expected values. This installment of the NSDC Data Science Flashcards series was created and recorded by Stephanie Guo. You can find these videos on the NEBDHub Youtube channel. Hello […]