This NSDC Data Science Flashcards series will teach you about geospatial analysis, including visualizations, data processing, and applications. This installment of the NSDC Data Science Flashcards series was created and recorded by Emily Rothenberg. You can find these videos on the NEBDHub Youtube channel.
Today, we’ll be learning how to solve for the sample variance of a small dataset.
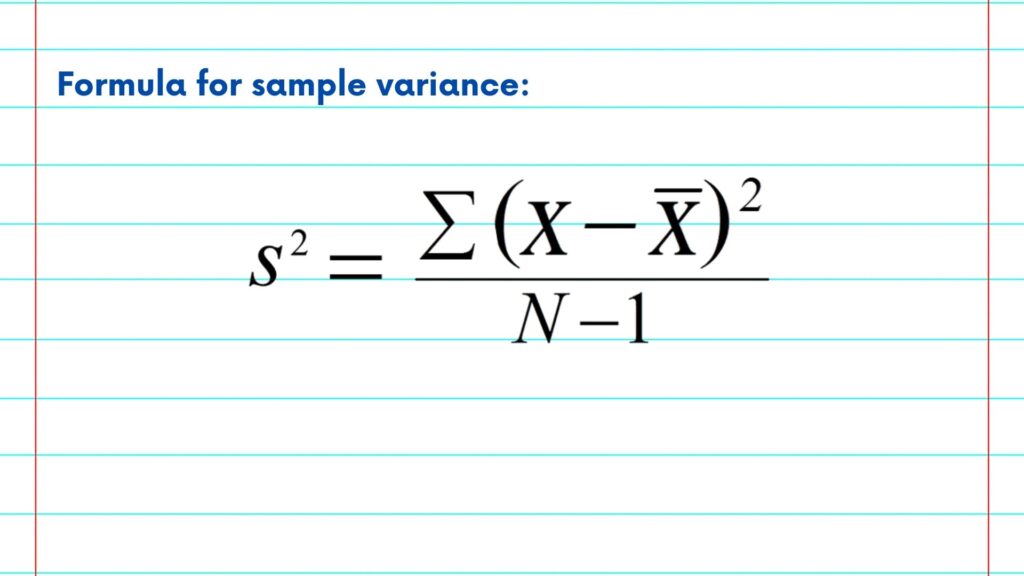
This is the formula to solve for the sample variance. It can be a bit intimidating, but let’s go step by step.
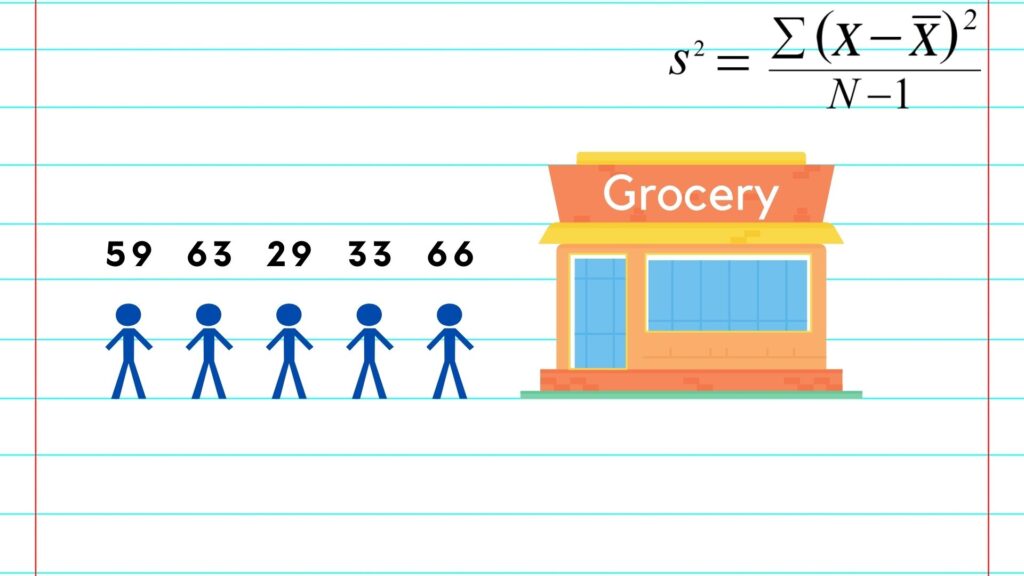
Let’s pretend we’re looking at the ages of the first five people to enter a grocery store. Here, we can see that our dataset includes the numbers 59, 63, 29, 33, and 66.
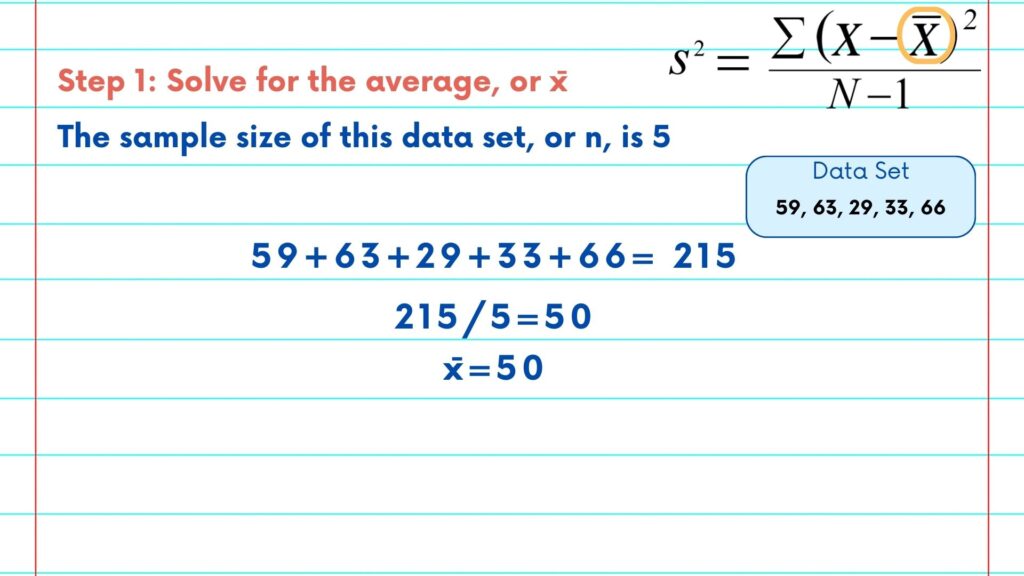
The next step will be to solve for the mean or the average.
To do this, we will add all of the numbers together and divide by n, or our sample size. We can see here that the mean, also represented as xbar, is 50.
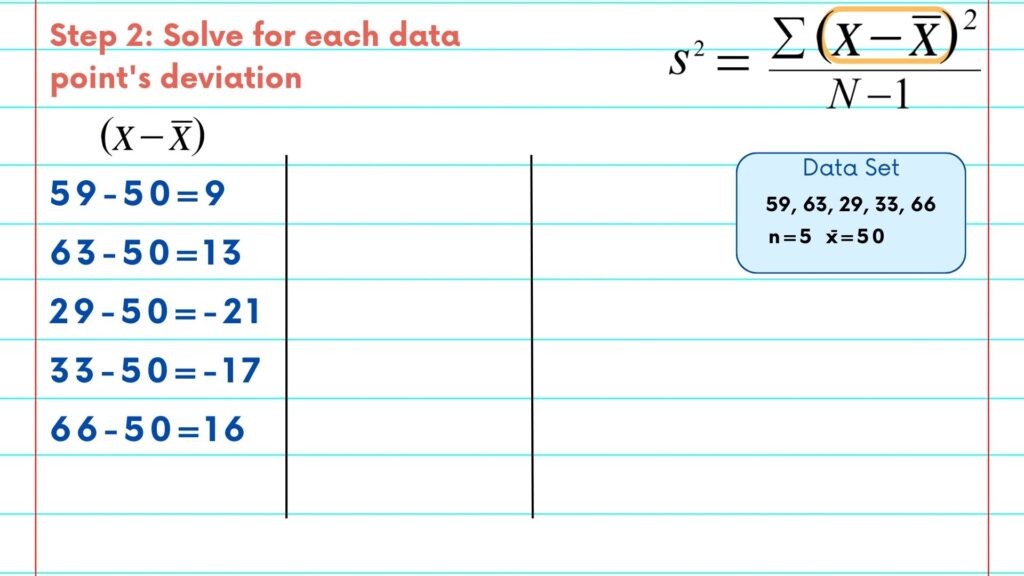
The next step is to find each age’s deviation from the mean. So, in simple terms, we need to subtract the mean or 50 from each age to see how far away it is.
So, 59-50 is 9; 63-50 is 13; and so on.
It is okay if your answers are negative because of our next step.
We’ll use another column in this table now to square each deviation. Again, variance is known to be the square of the standard deviation.
So, 9^2 is 81. 13^2 is 169; and so on.
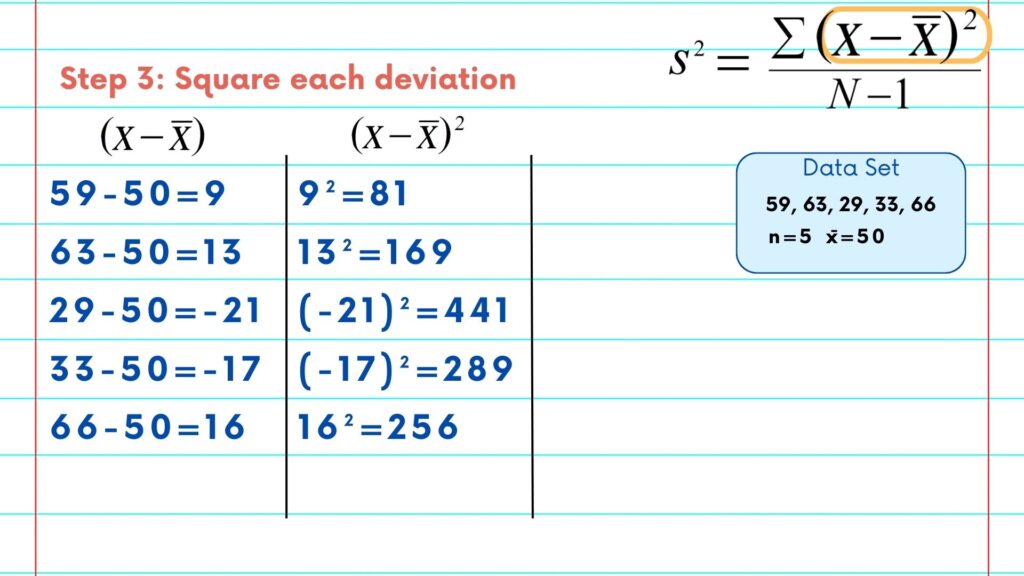
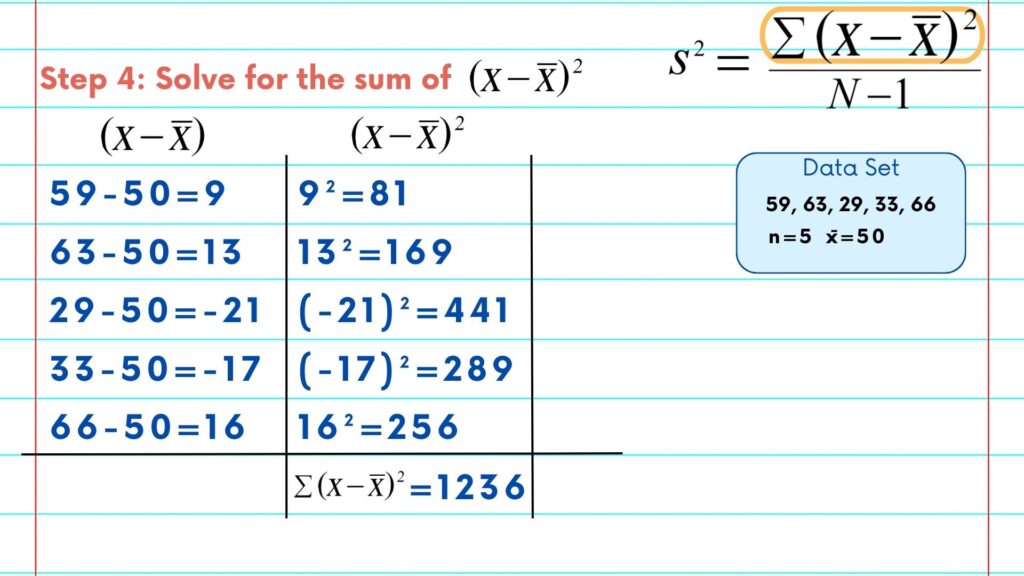
Okay, we’re almost there. So now we need to add all of our squares together to get the sum of the squares. Adding those together, we get 1,236.
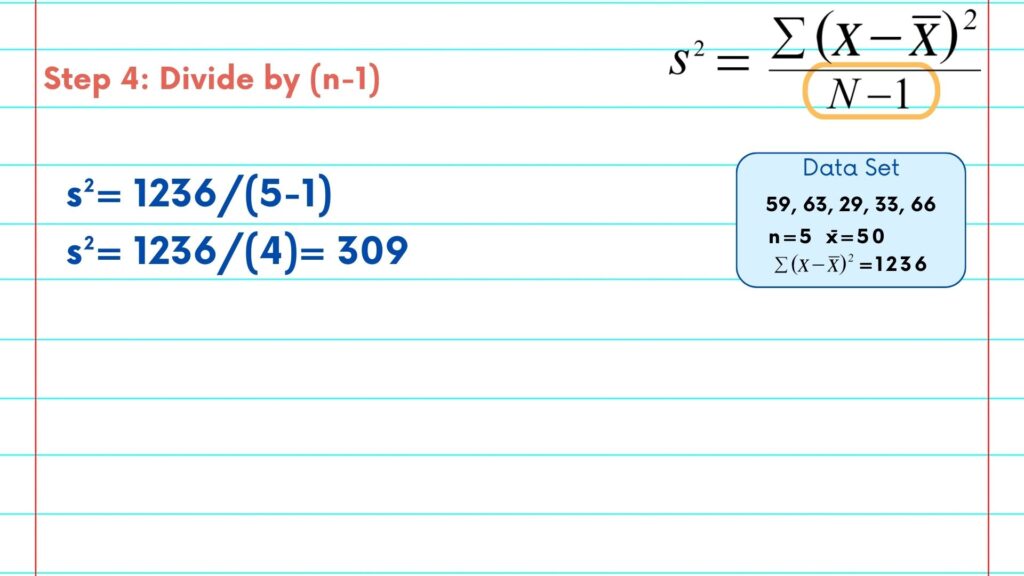
Now for the last step – you can see in the formula that we need to divide by n-1. Here, n or our sample size is five, so n-1 is 4. 1236/4=309 also known as your solved variance.
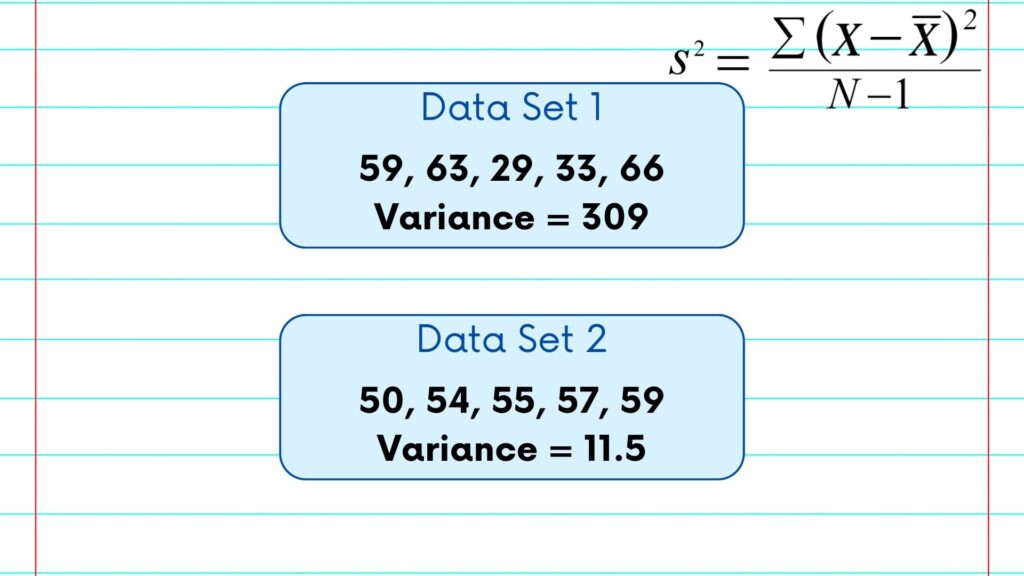
What does this mean? 309 is a larger number which tells us the numbers in our data set are dispersed, or spread out quite a bit. Our dataset included numbers from 29, all the way up to 66.
If the ages all happened to be in their 50s, your variance would’ve been much smaller.
Please follow along with the rest of the NSDC Data Science Flashcard series to learn more about math and probability.
