COVID-19 Data Dashboard Project
Project Description
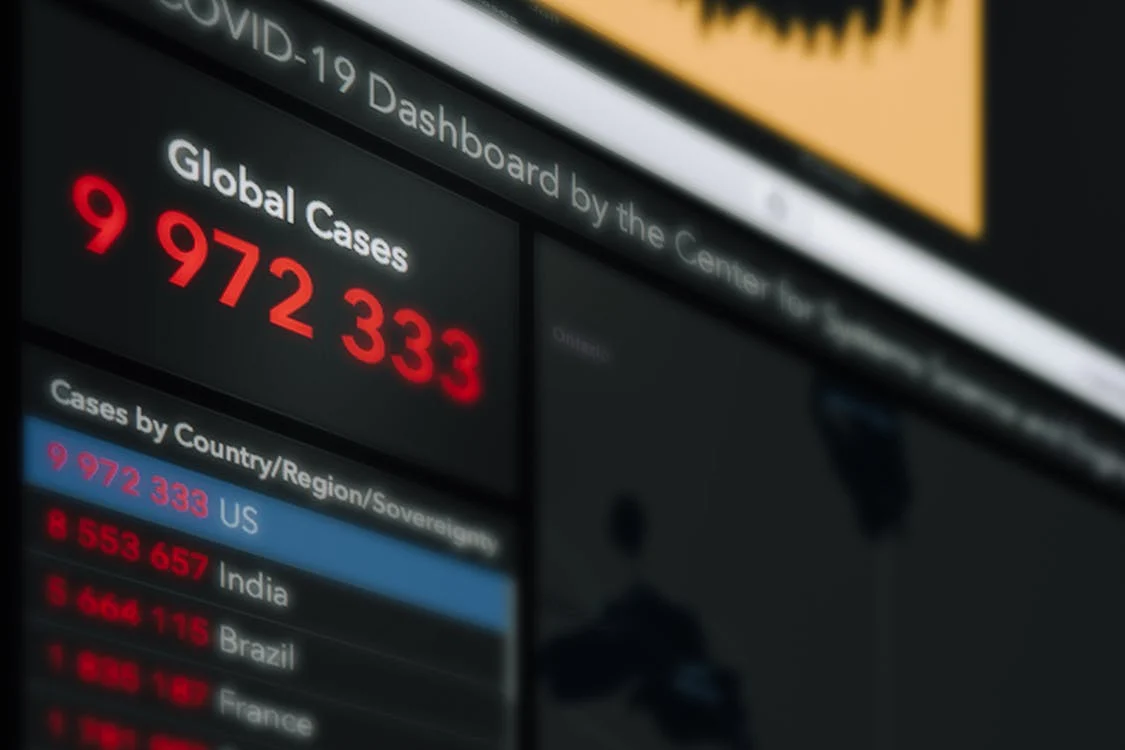
This project will introduce learners to an array of skills as they strive to create a data visualization dashboard focusing on COVID-19 data using Python. Data visualization is a quintessential part of any data science project and offers us valuable insights for understanding and translating data.
If you’d like to learn more about the COVID Information Commons (CIC) Student Working Group, including future projects and examples of submitted student projects, visit the CIC website.
Dataset
Relevant Skills You May Apply
Basic Python Programming and Data Visualization Tools
Skills You May Gain
Data Visualization skills and Python Programming skills
Total Time
Approximately 15 to 25 hours (3 to 5 weeks)
Milestones
Milestone 1: Data Preparation and Exploration
Milestone 2: Geographic Analysis
Milestone 3: Data Visualizations
Milestone 4: Self-Guided Analysis of a Different World Health Organization (WHO) Region
Deliverables
Deliverables include a project report highlighting new skills gained and an interactive Python notebook (Jupyter/Google Colab).
